Technical details
The site was made in PHP, used MySQL as the database, and Apache as the webserver. PHP was running as a web server module, and we used an inhouse framework, and Doctrine2 as the ORM layer. Now I already hear the shouting that using any kind of ORM is a big no-no when scalability is an issue. This is mentioned each time the ORM vs. write SQL by hand for models debate comes up, so let's get this part out of the way first.
The framework has already grown pretty dependent on Doctrine, for the various CRUD operations, on the administration pages. This was a conscious choice, and we really did not want to rewrite that part.
Also, I'm skeptical. I believe, that if you don't do stupid stuff, like blindly lazy/eager loading associations, but actually look at how your entites are used, and do queries based on that, the overhead is manageable, and the time that you save on continously rewriting the queries (as the requirements change) for the models is tremendous. I'm not a die hard believer of this, but I want to experience the scenario where the ORM actually kills scalability, before believing it. You could say I'm skeptical, and inexperienced, alright.
An unusal way of caching things
It was an interesting task, with many possibilities to learning something new. I thought about reading up on Sphinx to spare the MySQL server of the free text searching (we used LIKEs). I also planned to set up nginx on a spare server to serve the minimzed static assets, like JS and CSS files, look at the slow query log to determine which queries take a long time, look at the ORM generated queries to see if there are any N+1 queries. See the rage comic on the right, on how that turned out.
Pretty much my grand ideas were shot down by the lead dev, who advocated a cache the whole HTML output solution. In a nutshell:
- Make a hash out of the current request uri eg. /products, or /products/awesome-shampoo
- Use that hash as the key, to see if we have a cached version
- If we have a cache hit, send the output from the cache, and end execution
- If not, turn on output buffering
- Render the page normally
- Capture the output, and place it in the cache, with the previously generated hash as the key
- Send output to the client
It meant that we will have to announce a "freeze date" to the client, after which we turn the site into a read-only mode. Nobody can register anything after that point. If there is a typo in the templates, that is there to stay. Every page that needs information from cookies (and hence, session) will be unusable, and have to be turned off. We will not be able to fix bugs after release. Now you could say, that we should just skip hashing the URL, and then we can selectively empty items from the cache, but that's not entirely true. You still have to somehow guess what pages use the stuff that you just changed. Eg., if you fix a typo in a product's description in the database, you will have to invalidate all the list pages, the sidebars, everything that it can turn up on, which you cannot determine with 100% accuracy.
You could empty the whole cache, but that isn't safe either, because the whole reason we are caching, is that we are not sure if we can keep up with the load. Flushing out the cache under a site that is being kept alive by it, is not a good idea.
I was 90% sure that there is no way we will get a green light to a site freeze like this, so after implementing the caching solution mentioned above, I still had some time left, so I went profiling the code.
Profiling with XDebug and KCacheGrind
I wanted to profile the code, to see where the hotspots, and bottlenecks are. We had a spare server just lying around, that I planned to use with nginx, to serve the static stuff. Instead of that, I set up PHP/Apache/MySQL on it, with XDebug, and enabled profiling. Let's look at the information with KCacheGrind.
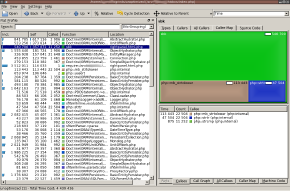
The visualized calling map is nice, but the interesting information is on the left side. The 2 columns that we are interested in is Incl. (inclusive), and Self. The difference between them is that self only counts the function itself, while inclusive also counts everything else that the function calls. So, the inclusive cost for index.php will almost always be 100%, because that is where execution starts. What you usually want to look at when optimizing, is the self column (the list is sorted on that, on the right).
Looking at the dumps with KCacheGrind, there were three things taking up most of the resources:
- An included template, named rightpanel.html.php
- A function named sbk
- Doctrine related stuff
Rightpanel.html.php was very suspicious, note the very high inclusive cost. It meant that the template itself does not do anything costly, but it calls something, that is costly. A template shouldn't do that, that would be the controllers job.
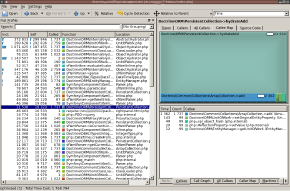
I also did not know what is sbk. The "Callees" tab showed that it calls two other functions, mb_strtolower(), and strtr(). Looking at the "Callers" tab revelead that it is called by usaort(). Okay, so it has to be a comparator function for sorting something?
I couldn't really do anything with Doctrine. I'm pretty sure the team behind it knows what they are doing, and even if they didn't optimize the code, I'm pretty sure I don't have the knowledge to do that myself.
Let's look at rightpanel.html.php first. It turns out one coworker had the idea that he would sort an array with ~1200 elements, in a template, using uasort(). The sbk() function was also defined here, inside the template. This function was called 11 512 times in a single request, according to the profile logs. I don't know why he picked uasort() for sorting, considering that the elements came from a query, so all that was needed was tacking an ORDER BY to the end of query (I did ask, and he didn't know either). So added the ORDER BY clause, and this solved both the first and second points.
The N+1 problem
In case you are not familiar with the expression, the N+1 problem is when you have an entity with a to-many relation to another entity, and you execute 1 query to get the root entity, and execute N queries to get all the related entities (the many side), resulting in N+1 queries. I don't have to say how inefficient is this, and I have a feeling this is why many projects blame the ORM for not scaling. You can avoid this, if you correctly use your ORM.
I had an SQL logger set up for Doctrine, that was logging to FirePHP, so I have seen every query that ORM has executed for the current page. On every single page, there was more than a thousand queries running (not joking on that number). They were all SELECTs querying the same table, with different WHERE id = ? clauses. It was immediately obvious that this is an N+1 problem. Since every page produced highly abnormal amount of queries, the problem had to be in a common template, like the header/footer/sidebars, that are pulled in on every page.
My first call was to look at rightpanel.html.php again. It displayed an input element for the free text searching, and the popular tags. The input box had nothing to query the DB for, so it had to be the tags. It's easier to show the code:
<?php
$results = array();
foreach ($categoryList as $C) {
  if($C->getName() != null) {
    $results[$j]['name']=$C->getName();
    $results[$j]['slug']=$C->getSlug();
    $results[$j]['dname']=$C->getCorrectedName();
    $jj = 0;
    foreach( $C->getDiscounts() as $D){
      if($D->getApproved() == 1) {
        $W = $D->getWebsite();
        $P = $W->getPartner();
        if($W->getApproved() && $P->getStatus()) $jj++;
      }
    }
    $results[$j]['discounts']=$jj;
    $j++;
  }
}
I'm also not sure what is happening here. It was building an array from the object graph. Huh. Judging from the line on 12, I figured the requirement probably was to show categories, and count how many active discounts they have. An active discount is one that is approved, and belongs to a website that is also approved, and the website belongs to a partner that is approved. Not really sure what it does with $jj, but it does not matter. The DQL query that assembled $categoryList looked like this:
SELECT dc, SIZE(dc.discounts) s
FROM d:DiscountCategory dc
HAVING s > 0
ORDER BY s DESC
If you are not familiar with Doctrine2, this means to select all the DiscountCategory entities from the database, and the count of how many Discounts they have. The problem is, that it only SELECTs DiscountCategory, but the template also makes use of it's relations, namely, Discount (on line 8), the Discount's website (on line 10), and the Website's Partner (on line 11). It traverses through 3 entities, but since those 3 (Discount, Website, and Partner) does not show up in the SELECT clause, it means they will be replaced by ghost proxies. A ghost proxy is a replica of the original class, that does a lazy-load (A single SELECT to the database) the first time it is accessed. The foreach() above accessed 3 of these lazy-loaded entities, meaning, each iteration cost 3 queries to the database. This is what was causing the N+1 problem (or, something more like a 3N+3 problem). Doing this with ~1200 entites is not healthy.
I could have added the missing entities to the SELECT clause, making it an eager load (result in a single query with an INNER JOIN), but, if you look at the code, the only reason the entites are traversed, is to see if a category has at least one discount that is active, and that discount has an approved owner (Partner). I could specify this condition on the query, with either a WHERE clause, or a INNER JOIN ... ON ... clause, eliminating the need to check in the foreach. The final query ended up being:
SELECT dc, d
FROM d:DiscountCategory dc
JOIN dc.discounts d WITH d.approved = 1
JOIN d.website w
JOIN w.partner p WITH p.approved = 1
ORDER BY dc.name
I removed the SIZE() clause, and instead added the Discount entity to the SELECT clause, and count()ed the Discounts in the template. The template code ended up looking like this:
<?php foreach ($categoryList as $category) {
  $count = count($category->getDiscounts());
?>
<a href="/tag/<?=$category->getSlug()?>"><=$html->escape($category->getName())?> (<?=$count?>)</a>
}
Lo, and behold, this cut back on the number of queries greatly, resulting in only ~15 for the front page. Let's do another profiling on the now optimised code. Also, I'll show the graph from Munin this time:
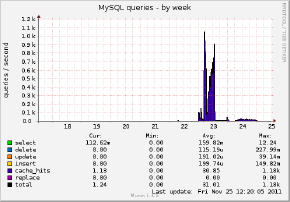
Unfortunately I forgot to save a screenshot of the daily graph, which was much more dramatic, but you can see that we went from ~1000 queries/second to <300/second, but anyway, much better! Counting the top10 calls, we went from ~2200k units, to ~1000k units (I have no clue what kind of units are those numbers. The manual also doesn't mention it. The bigger the number, the more resources a call takes). Also, look at the Doctrine related numbers. Getting rid of the N+1 query, they also became a much friendlier number.
After the release
I'm still surprised by this, but the lead have somehow convinced the client to allow us to freeze the site, so the caching solution was given a green light, but it turned out we are nowhere near the expected numbers (~24k unique visitors, and ~86k page views in the end). We were monitoring the load, and it was nothing to be worried about, so didn't even turn on the cache. Fixing the bottleneck in the right panel, and fixing the N+1 query was more than enough, and I'm pretty sure we could have handled a lot more visitors without turning it on.